
Citizen Survey
As part of the comprehensive plan update, the City conducted a citizen survey to measure citizen satisfaction and major issues in which the City would be facing in the coming years. Approximately 1,000 citizens were called and asked a variety of questions in which their responses provided the City with insight into the Framework for the Future update process, including feedback about quality of life and City services.
Satisfaction with Quality of Life in Newport News
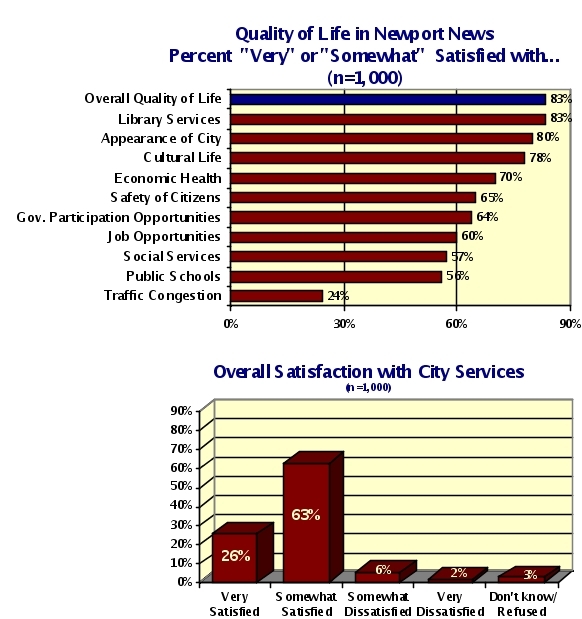
"To understand more about citizens' perceptions of the City and the quality of life it offers, respondents reported their levels of satisfaction with several aspects of the City. In addition to the characteristics of the city presented in previous years, this year's study covered several new aspects, including satisfaction with library services and traffic congestion in the city." (1) The first graph in Figure 1-2, "illustrates the percentages of citizens that are very or somewhat satisfied with different services within the City. Approximately 83% of the respondents are satisfied with the overall quality of life in the City of Newport News. Three fourths or better are satisfied with the library services offered by the City, its appearance and cultural life." (2)
Satisfaction with City Services
"Respondents were asked to describe how satisfied they are with the services provided by the city. Slightly more than one fourth (26%) say the are very satisfied, while nearly two thirds (63%) say they are somewhat satisfied. Only 8% expressed any dissatisfaction." (3) These results are illustrated in the second graph found in Figure 1-2. "When compared to the results of the 1997 study, there is a decrease in the percent of respondents who say they are very satisfied with city services (26% in 2006 vs. 31% in 1997). Respondents who are very satisfied are most likely to ...
- Be aged 35 years or older (29%)
- Be non-minority (32%)
- Have no children at home (31%)
- Compare Newport News very favorably with other Tidewater cities (38%)
- Vote regularly in local elections (30%)
- Be residents of Planning Districts II and IV (33% and 27%)
On the other hand, those who are somewhat or very dissatisfied with City services in general are likely to ...
- Be less educated (11%)
- Be part of a minority group (15%)
- Have children living at home (12%)
- Have household incomes of less than $50,000 (13%)". (4)