Crime Rate
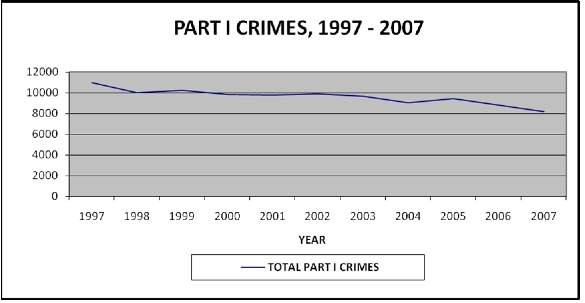
Part I crimes are defined as major offenses by the FBI’s uniform crime reports. The number of Part I crimes, which include homicide, rape, robbery, aggravated assault, burglary, larceny, and auto theft have declined in the City. The Newport News crime rate in 2007 was 4,385 reported Part I crimes per 100,000 persons. This is a 19% drop since 1998 or a 2.1% average annual decrease over this period of time. (See Table 8-1 and Figure 8-2) Newport News’ crime rate is higher than in Suffolk, Virginia Beach, Chesapeake, Hampton and Norfolk, but is less than in Portsmouth. Current information on current and past crime trends in Newport News can be found on the Police Department’s web site.
The number of Part I crimes and the overall crime rate have declined since 1992 when the City’s crime rate peaked. Many factors have influenced this decline. In the past ten years the Police Department has hired more officers, strengthened its community policing efforts and created more patrol areas. The lower crime rate was helped by a strong economy. In years when the unemployment rate increased, the crime rate went up. Conversely, the crime rate fell when unemployment dropped. This relationship has held over the past decade. However, other factors that affect the City’s crime rate include the percentage of young males in the City’s population, environmental factors such as vacant and dilapidated housing and boarding houses, drug abuse, the success of social service programs such as welfare to work, and programs concerned with crime prevention among our youth.
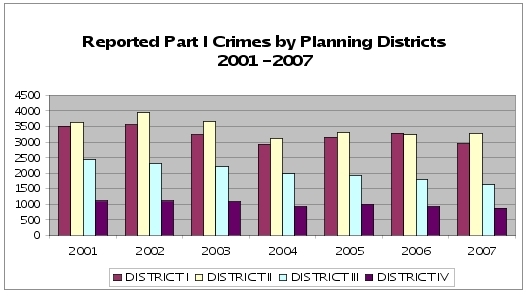
Since 2001, the overall trend for all Planning Districts has been a drop in the number of Part I crime offenses and a corresponding decline in the overall crime rate. Table 8-2 and Figure 8-3 describe the number of Part I crime offenses by planning district. There has been a general downward trend in the number of crime offenses in every planning district in the City. Planning District 2, which has the highest population (71,083) and most commercial development in the City, has the highest number of Part I crime offenses. Planning District 1, which has a smaller population (33,513), has fewer crimes. Planning District 4, which has the smallest population of the City’s planning districts (25,122), has had the fewest number of Part I crime offenses.
|
YEAR |
TOTAL PART I CRIMES |
CRIME % CHANGE |
POPULATION |
POPULATION % CHANGE |
CRIME RATE |
CRIME RATE % CHANGE |
|---|---|---|---|---|---|---|
|
1997 |
11,002 |
- |
183,185 |
- |
6,006 |
- |
|
1998 |
10,043 |
-9% |
184,683 |
0.82% |
5,438 |
-9% |
|
1999 |
10,270 |
2% |
184,604 |
0.00% |
5,563 |
2% |
|
2000 |
9,847 |
-4% |
180,697 |
-2.12% |
5,449 |
-2% |
|
2001 |
9,780 |
-1% |
181,691 |
0.86% |
5,383 |
-2% |
|
2002 |
9,924 |
1% |
183,740 |
1.13% |
5,401 |
0% |
|
2003 |
9,667 |
-3% |
185,224 |
0.81% |
5,219 |
-3% |
|
2004 |
9,055 |
-6% |
185,242 |
0.01% |
4,888 |
-6% |
|
2005 |
9,478 |
5% |
186,000 |
0.41% |
5,096 |
4% |
|
2006 |
8,830 |
-7% |
186,980 |
0.53% |
4,722 |
-7% |
|
2007 |
8,200 |
-7% |
187,022 |
0.02% |
4,385 |
-7% |
|
YEAR |
DISTRICT I |
DISTRICT II |
DISTRICT |
DISTRICT |
CITYWIDE |
||||
|---|---|---|---|---|---|---|---|---|---|
|
Number |
% |
Number |
% |
Number |
% |
Number |
% |
Total |
|
|
2001 |
3,507 |
33 |
3,646 |
34 |
2,421 |
23 |
1,108 |
10 |
10,682 |
|
2002 |
3,553 |
33 |
3,945 |
36 |
2,308 |
21 |
1,110 |
10 |
10,916 |
|
2003 |
3,249 |
32 |
3,659 |
36 |
2,205 |
22 |
1,090 |
11 |
10,203 |
|
2004 |
2,921 |
33 |
3,136 |
35 |
1,987 |
22 |
919 |
10 |
8,963 |
|
2005 |
3,144 |
34 |
3,300 |
35 |
1,937 |
21 |
994 |
11 |
9,375 |
|
2006 |
3,285 |
36 |
3,238 |
35 |
1,800 |
19 |
919 |
10 |
9,242 |
| 2007 | 2,939 |
34 |
3,279 |
38 |
1,626 |
19 |
875 |
10 |
8,719 |